linux服务器中,使用top命令可以很清楚的看到每个程序的cpu、内存占用情况,加上-c参数即可从程序名称(Program-name)切换到程序完整命令行模式(Command-line),如果只是想查看当前时间节点下的程序占用情况,这是最简单的方法,但如果想要查看历史进程的占用情况top命令就无法解决这个问题了。
想象一个场景,在凌晨2点我们还在熟睡的时候,服务器崩溃了,第二天我们才发现,但是阿里云等控制台只能显示一个cpu、内存汇总趋势图,却不能看到具体的进程情况,如果可以查到昨晚服务器崩溃时各程序进程占用cpu及内存的变化情况,那么对排查服务器崩溃的具体原因就很有帮助了。
首先我们得知道ps aux的用法,`ps aux` 是一个用于显示当前运行在系统上的进程信息的命令。`ps`: 是进程状态的缩写,它用于报告当前系统的进程状态,而aux等参数的含义如下:
- a: 显示所有用户的进程,而不仅仅是当前终端的进程。
- u: 以用户为中心的格式显示输出,包括更详细的信息,如用户、进程ID(PID)、%CPU、%MEM、VSZ(虚拟内存大小)、RSS(驻留集大小)、TTY(终端类型)、STAT(进程状态)等。
a和au的区别如下: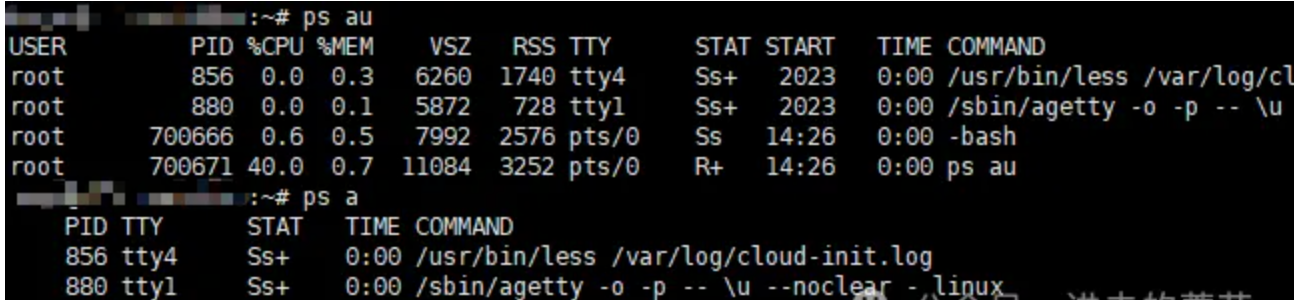
- x: 这个选项是用于显示不与终端关联的进程。在 ps aux 中,x 使得命令显示所有进程,而不仅仅是当前在终端中运行的进程。
可以看到,通过aus命令我们其实是可以获取到当前程序进程的cpu以及内存占用大小的,在这个基础上,再加上一个参数用于倒序排列,例如:
ps aux --sort=-%cpu
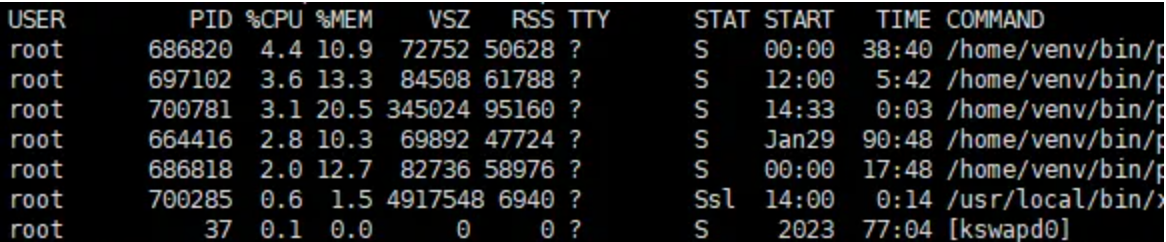
--sort=-%cpu 的部分指定了按照 %CPU 的降序排列显示的顺序,最高的排在最前面。--sort: 指定排序的字段。- 表示降序,如果是 --sort=%cpu 则表示升序。
同理,如果想要获得程序内存占用的统计,使用ps aux --sort=-%mem即可。
继续使用awk来进行优化提取,例如:
awk 'BEGIN {current_date = strftime("%Y-%m-%d");current_time = strftime("%H:%M:%S");OFS=",";} NR >1{print current_date,current_time,$1,"mem",$4, $10,$11" "$12" "$13" "$14" "$15}'
BEGIN: 这是 awk 中的一个特殊模块,在处理之前执行一次,用于初始化变量。
current_date 和 current_time 分别存储当前日期和时间。
OFS=",": 设置输出字段分隔符为逗号。
NR > 1: 表示只处理行号大于1的行,即忽略 ps 命令输出的标题行。
{print current_date, current_time, $1, "mem", $4, $10, $11" "$12" "$13" "$14" "$15}: 打印出处理后的信息,包括当前日期、时间、进程ID($1)、"mem"(标识是内存信息)、%MEM($4)、命令的起始部分($10),以及进程的参数($11 至 $15)。
如此我们就获取了一个类似excel表格的csv数据,其中每一行代表一个进程的统计数据以及运行的具体命令
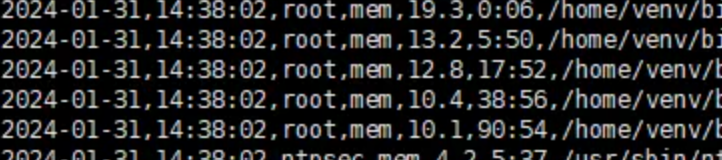
再写入到文件中:
head -20 >> $filepath$filename
完整代码就两行:
ps aux --sort=-%cpu | awk 'BEGIN {current_date = strftime("%Y-%m-%d");current_time = strftime("%H:%M:%S");OFS=",";} NR >1{print current_date,current_time,$1,"cpu",$3, $10,$11" "$12" "$13" "$14" "$15}'| head -20 >> $filepath$filename
ps aux --sort=-%mem | awk 'BEGIN {current_date = strftime("%Y-%m-%d");current_time = strftime("%H:%M:%S");OFS=",";} NR >1{print current_date,current_time,$1,"mem",$4, $10,$11" "$12" "$13" "$14" "$15}'| head -20 >> $filepath$filename
此时差不多就完工了,再加一个定时脚本就可以使用了,但是这样的csv文件没有列名,看着并不太直观,继续优化,完整的shell脚本:
#bin/bash
#This script is designed to maintain daily statistics of CPU and memory usage by a program.

filepath="/home/smemTongji/cpulog/"
filename="tongji_cpu_mem_$(date -d today +%Y-%m-%d).csv"
# 字符串内容
header="Date,logTime,User,Type,percent,Time,Command"

if [ -e "$filepath$filename" ]; then
    echo "File already exists. Not creating a new one."
else
    echo "$header" > "$filepath$filename"
    echo "header created successfully."
fi

# cpu是$3
ps aux --sort=-%cpu | awk 'BEGIN {current_date = strftime("%Y-%m-%d");current_time = strftime("%H:%M:%S");OFS=",";} NR >1{print current_date,current_time,$1,"cpu",$3, $10,$11" "$12" "$13" "$14" "$15}'| head -20 >> $filepath$filename
# 内存是$4
ps aux --sort=-%mem | awk 'BEGIN {current_date = strftime("%Y-%m-%d");current_time = strftime("%H:%M:%S");OFS=",";} NR >1{print current_date,current_time,$1,"mem",$4, $10,$11" "$12" "$13" "$14" "$15}'| head -20 >> $filepath$filename
文件名会自动跟随每天的日期命名,所以不用考虑日志切割的问题,通过判断日志文件是否存在来创建列名,最后底部的管道输出以追加的形式添加到文件,这样可以保留每日日志留待检查。
不过这样还是不太直观,可以利用matplotlib来绘制一个直观的图表观察,例如我现在已经有了一份日志文件,绘制如下:
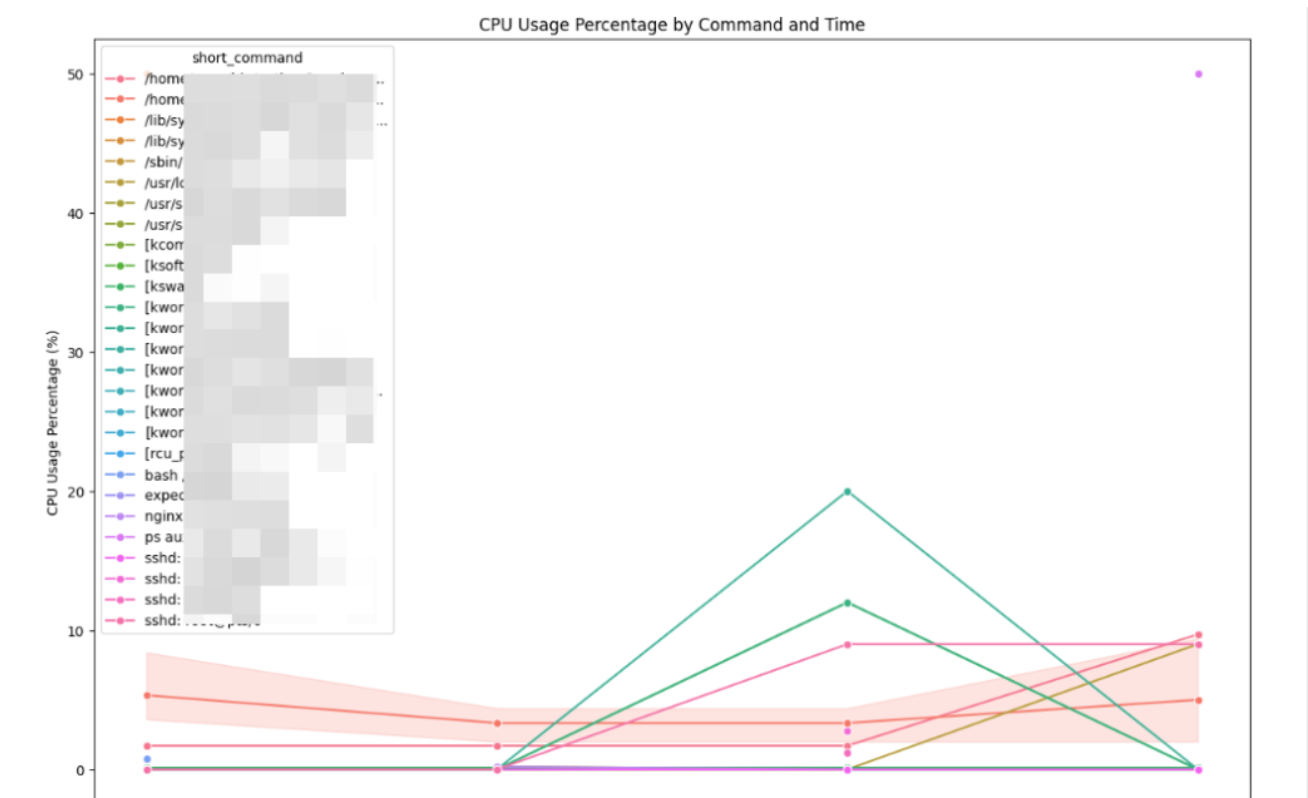
这样在某个时间段有程序异常就很好查看了,cpu统计完整代码如下:
base_dir =r"D:\backup"
file_name = os.path.join(base_dir, "tongji_cpu_mem.csv")

start_time = "15:00:00"
end_time = "15:21:00"

df = pd.read_csv(file_name)
# Filter the DataFrame for 'cpu' type
cpu_df = df[df['Type'] == 'cpu']
cpu_df = cpu_df[cpu_df['logTime'] > start_time]
cpu_df = cpu_df[cpu_df['logTime'] < end_time]
# 按 'Command' 和 'logTime' 分组,计算 'percent' 列的均值
cpu_grouped = cpu_df.groupby(['Command', 'logTime'])['percent'].mean().reset_index()
# 根据 'Command' 和 'logTime' 对 DataFrame 进行排序
cpu_grouped = cpu_grouped.sort_values(by=['Command', 'logTime'])
# 为了更好的可视化,缩短 'Command' 文本
cpu_grouped['short_command'] = cpu_grouped['Command'].apply(lambda x: x[:30] + '...' if len(x) > 30 else x)

# Plot the graph again with the shortened command text
plt.figure(figsize=(15, 10))
sns.lineplot(data=cpu_grouped, x='logTime', y='percent', hue='short_command', marker='o')
plt.title('CPU Usage Percentage by Command and Time')
plt.xlabel('logTime')
plt.ylabel('CPU Usage Percentage (%)')
plt.xticks(rotation=45)

# Show the plot
plt.show()
内存统计完整代码如下:
mem_df = df[df['Type'] == 'mem']
mem_df = mem_df[mem_df['logTime'] > start_time]
mem_df = mem_df[mem_df['logTime'] < end_time]
# Group by 'Command' and 'Time' and calculate the mean of 'percent'
mem_grouped = mem_df.groupby(['Command', 'logTime'])['percent'].mean().reset_index()
# Sort the DataFrame for better visualization
mem_grouped = mem_grouped.sort_values(by=['Command', 'logTime'])
mem_grouped['short_command'] = mem_grouped['Command'].apply(lambda x: x[:30] + '...' if len(x) > 30 else x)
# Plot the graph again with the shortened command text
plt.figure(figsize=(15, 10))
sns.lineplot(data=mem_grouped, x='logTime', y='percent', hue='short_command', marker='o')
plt.title('MEM Usage Percentage by Command and Time')
plt.xlabel('logTime')
plt.ylabel('MEM Usage Percentage (%)')
plt.xticks(rotation=45)
# Show the plot
plt.show()
也许日志堆积的太多也很苦恼,可以考虑补充一个shell脚本用于删除几天前的日志文件:
filepath="/home/smemTongji/cpulog/"
days_threshold=4

# 获取当前日期
current_date=$(date +"%Y-%m-%d")

# 计算阈值日期
threshold_date=$(date -d "$current_date -$days_threshold days" +"%Y-%m-%d")

filename="tongji_cpu_mem_$threshold_date.csv"

echo $filepath$filename;

rm $filepath$filename;