基本上就是通过官方的GraphQL Analytics API文档链接进行操作(无论是免费版还是收费版的CF均可使用此功能),备注如下:
首先下载一个可用的客户端Clients方便在本地可视化测试,官方简介中使用的GraphiQL轻量级的app,因此先安装:
# macOS installation
brew install --cask graphiql
如果githup确实太慢,也可以直接进入到网址直接下载:
https://github.com/skevy/graphiql-app/releases
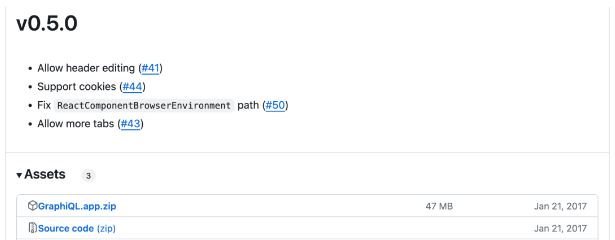
由于本人的mac笔记本版本确实太老了,最后安装了v0.5.0版本才可以正常使用。
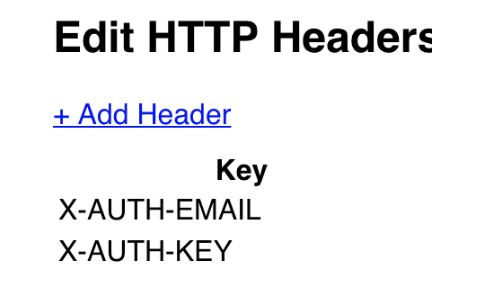
安装官网,先配置API key
设置X-AUTH-EMAIL,authentication分为两种,一种是Token authentication(官网推荐),另外一种是Key authentication,我采取的是Key authentication所以添加标头X-AUTH-KEY,如果是官网推荐的方法,标头应当是Authorization
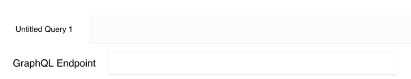
在GraphQL Endpoint中输入:
https://api.cloudflare.com/client/v4/graphql
新建一个query,就可以尝试添加查询规则了,例如我想要查询13号北京时间12点23分到12点42分之间的ip抓取信息(时间需要转换成零时区):
query
{
  viewer
  {
    zones(filter: { zoneTag:$tag})
    {
      firewallEventsAdaptive(
          filter: {
            datetime_gt: $start,
            datetime_lt: $end,
            userAgent_notlike:"%Google%"
          },
          limit: 1000,
          orderBy: [clientIP_DESC],
          )
      {
        clientIP
      }
    }
  }
}
{
  "tag": "<zone-tag>",
  "start": "2024-03-12T15:23:21Z",
  "end": "2024-03-12T15:41:21Z"
}
如果想要聚合数量呢,我们可以使用zone类下面的firewallEventsAdaptiveGroups来编写(需要注意,这个功能需要付费账户才可用,免费账户使用会出现 does not have access to the path. Refer to this page for more details about access controls: https://developers.cloudflare.com/analytics/graphql-api/errors/):
query
{
  viewer
  {
    zones(filter: { zoneTag:$tag})
    {
      firewallEventsAdaptiveGroups(
          filter: {
            datetime_gt: $start,
            datetime_lt: $end,
          },
          limit: 10000,
          orderBy: [count_DESC],
          )
      {
        dimensions
        {
          clientIP
        }
        count
      }
    }
  }
}
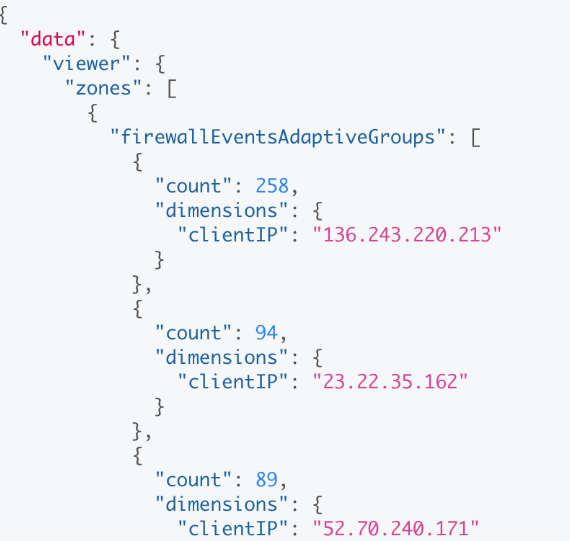
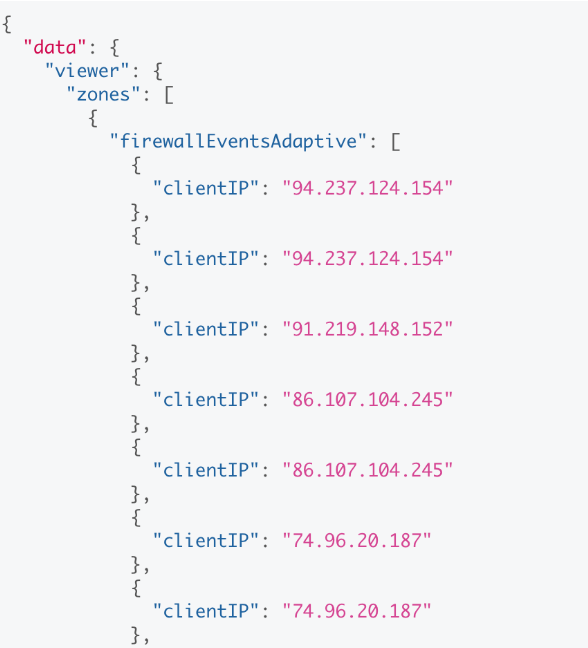
我们以免费版本的输出为例,当获取到的数据如下所示,可以考虑写一个python脚本来聚合统计:
python脚本:
import json
from collections import Counter
file = r"/Users/GraphQLout.json"
# 读取 JSON 数据
with open(file) as f:
data = json.load(f)
# 提取 clientIP 列表
client_ips = [event['clientIP'] for zone in data['data']['viewer']['zones'] for event in zone['firewallEventsAdaptive']]
# 使用 Counter 统计 clientIP 数量
ip_counter = Counter(client_ips)
# 按数量多少进行排序
sorted_ips = sorted(ip_counter.items(), key=lambda x: x[1], reverse=True)
# 打印结果
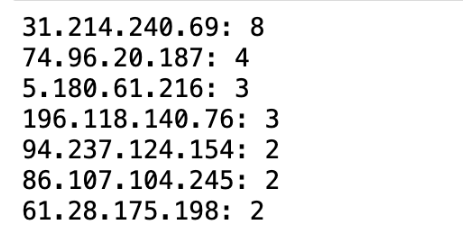
for ip, count in sorted_ips:
print(f"{ip}: {count}")
顺便备注下jupyter自动换行的方法:
在 cmd 中查看 jupyter 的配置文件路径,一般都是 .jupyter 的文件夹。
jupyter --config-dir
sudo vim /Users/.jupyter/jupyter_notebook_config.py
添加如下代码:
{
  "MarkdownCell": {
    "cm_config": {
      "lineWrapping": true
    }
  },
  "CodeCell": {
    "cm_config": {
      "lineWrapping": true
    }
  },
  "Cell": {
    "cm_config": {
      "lineNumbers": true
    }
  }
}
重启notebook即可。
参考:
https://developers.cloudflare.com/analytics/graphql-api/https://www.cnblogs.com/hider/p/15583219.html